Platinum: The Other White Metal

By Justin Dove – September 1, 2011

Gold is in a bubble. The rise in prices has been more about speculation and fear than supply and demand. It’s anyone’s guess as to when the bubble will burst. But it will eventually, just like real estate and tech stocks did over the past decade or so. But the idea that gold has surpassed the price of platinum at any point is unbelievable. It will never last.

Platinum credit cards are better than gold cards. “Going platinum” in the music industry is better than having a gold record. Likewise, platinum is a better investment than gold. When investing in platinum, think of it as a precious metal that will take advantage of the same things that drive gold, but without so much downside risk. In the chart below, it’s obvious that platinum rarely falls to gold prices. When a platinum bubble burst in 2008, it quickly reverted to its average level above gold.

[Click to enlarge]

Gold vs. Platinum

So now that gold and platinum are about equal, platinum is the metal to invest in. If gold goes down, platinum shouldn’t go down quite as far. If gold goes up, platinum should eventually rise higher. Any breaches of platinum’s price will be short-lived.

Some may suggest that gold is more of a currency and safe haven than platinum. But those that honestly believe the world is going to fall to anarchy may as well invest in guns and lead. Those will be far more valuable than gold in a post-apocalyptic world.

Now those using gold as an inflation hedge due to debt concerns may have a better case. But platinum is a superior metal to gold for two major reasons: Industrial demand and scarcity.

Industrial Demand For Platinum Spikes

According to the Platinum 2011 report by Johnson Matthey, gross demand for platinum grew by 16 percent in 2010. This was mainly driven by a 48 percent spike in gross industrial demand, and 43 percent growth of demand in the metal for catalytic converters.

The increase was magnified by the sharp drop in demand following the global crisis in 2009. However, emerging market demand is expected to continue the industrial upswing. One of the biggest trends in emerging markets is automobile consumption. Platinum is a vital component of catalytic converters in all vehicles, but especially in diesel cars.

Europeans began incorporating more diesel engines in 2010. The diesel market expanded to 48 percent of all European cars in 2010. This helped platinum demand in Europe grow 51 percent.

Production of heavy-duty diesel trucks increased in the United States and around the world. The United States also increased emission standards for heavy-duty diesel in 2010, leading to bigger loads of platinum in the catalytic converters.

Platinum is used in a plethora of other industries including glass-making for LCD and LED televisions screens, hard disk drives, plating and thermocouples.

Maybe all these doomsayers are on to something and the global economy will grind to a halt. But, there’s still a reason that platinum will always be more valuable than gold in the long run. Platinum is between 15 and 30 times more scarce than gold. All the platinum mined to date is said to fit within a 25 foot cube.

Adding to the scarcity is how expensive it is to produce. High prices have supplies expected to increase slightly over the next few years. But there is an obvious downtrend in global supply and production over the past five years.

Platinum Supply by Region, 06-11

Eventually demand should outstrip supply and raise prices to astronomical levels. However, if the world does end in 2012 platinum will still be 15 times more scarce than gold. While it may not be used as a currency, it should still carry a higher value.

Alternate Ways to Invest

Adding to the demand and scarcity of platinum are new exchange-traded funds – the most popular is the ETFS Physical Platinum Shares (PPLT) designed to track the precious metal. These funds soak up physical platinum and assume the costs and responsibilities of safely holding the metal. They also command a price of one-tenth the value of an ounce of platinum. This, plus the convenience of not having to safely store the physical metal, makes it a very attractive investment for average investors.

It may also be wise to get exposure to top platinum mining companies. These companies will profit highly from increased margins due to higher platinum prices. Here are some notable companies:

  • The number one company in the production of platinum group metals is Anglo Platinum Ltd (AGPPY.PK). It has a market cap of $37 billion and profit margin of 24 percent. Anglo Platinum is a subsidiary of mining giant Anglo American Plc (AAUKY.PK). Anglo American has an 80 percent stake in Anglo Platinum.
  • Stillwater (SWC) is an American platinum mining company based in Montana. It has a relatively small market cap of $1.47 billion, but is trading more than 40 percent below its 52-week high. Once the profits start to roll in from these high platinum prices, Stillwater should experience some growth.

Even if platinum doesn’t go any higher, it shouldn’t fall as much as gold will. The spread between the prices should eventually revert to normal platinum premiums. While gold has many uses and values as currencies, the scarcity and industrial uses of platinum will continue to balance it higher than gold.

Disclosure: Investment U expressly forbids its writers from having a financial interest in any security they recommend to our subscribers. All employees and agents of Investment U (and affiliated companies) must wait 24 hours after an initial trade recommendation is published on online – or 72 hours after a direct mail publication is sent – before acting on that recommendation.

http://seekingalpha.com/article/291228-platinum-the-other-white-metal

Silver to reach $50 by 2011, and gold at $8,000 by 2015 conservative – Turk

I totally agree with mr. Turk’s targets for 2011, although I don’t think gold will reach $8000. Perhaps I am just too conservative; so I might have to change my point of view once we get to my initial targets of 1600-2000$.

Source: Mineweb.com

GoldMoney CEO, James Turk says surging physical demand for the metals is pushing them into backwardation and should see gold hitting $2,000 per ounce this year

After a record breaking run during the course of 2010 and, indeed, the last 10 years, gold took a breather in January.

Part of the reason for the decline was a movement out of gold by investors in Europe and the US who had bought the metal as protection against further declines in the health of the global economic system. Sentiment improved and investors began once more to look at other asset classes that perhaps would offer better returns, prompting some commentators to question whether or not it is time to get out of gold.

James Turk, CEO and co-founder of GoldMoney is not one of those commentators.

Speaking at the Mining Indaba in Cape Town, Turk reiterated his view that gold will get to around $8,000 an ounce by perhaps 2015 adding, “I would say though, having seen QE2, that my predictions will turn out to be on the conservative side.”

Speaking to Mineweb on the sidelines of the conference, Turk brushed aside concerns about a decline in investment demand for the metal, saying that one must be clear to differentiate between the paper market [like ETFs] and that for physical gold.

“What drives the gold price at the end of the day is the demand for physical gold. We’re seeing that clearly now in silver which is in backwardation going out to 2015. Money never goes into backwardation unless you reach a position where you have extreme conditions – and that’s what we see in silver now – the demand for physical metal is so much higher that people don’t want paper any more, they want the real thing.”

Turk believes this backwardation, the situation where the price of a commodity for future delivery is lower than the price for immediate delivery, could happen to the gold market.

“We could see gold in backwardation too as people become more and more worried about the inflationary consequences of the money printing that’s going on around the world. Silver always leads – in bull markets it leads on the upside and in bear markets it leads on the downside. Maybe as precious metals move into backwardation, silver is again giving us an important message that it is leading and gold will eventually follow.”

Asked his view of what is likely to happen over the course of 2011, he says, “We’re probably going to see $1,800 – $2,000 this year on the gold price and silver looks like it’s going to go to at least $50, given the way the backwardation is forming right now… The demand for physical metal is just absolutely huge and the paper market is being more and more discredited as a price discovery mechanism. As a consequence you’re going to see even greater demand for physical silver as we go forward.

http://profitimes.com/free-articles/92

Platinum to gold ratio and detecting bubbles

An article on BespokeInvest about the Platinum-to-Gold ratio today drew my attention.
I therefore wanted to get to know more about this ratio. I knew that the ratio had been trading around 2 over the last 10 years, which was why I invested heavily in Platinum and its little sister metal Palladium in December 2008 and early 2009 when prices crashed, and Platinum became cheaper than gold (the ratio thus dropped below 1). When the economy rebounded, the ratio rebounded to 1.50, but the last couple of months, it has been declining again, and is approaching 1 again, as it is currently at 1.13 with gold prices around 1546 and Platinum around 1742.
I thus started to dig deeper and found historical data at kitco.com
I created an excel sheet with monthly average prices since 1968 which is available for download HERE.

Below you can see some interesting charts that resulted of some calculations in the Excel sheet.
The first chart is the nominal absolute price difference between one ounce of Platinum and one ounce of Gold.
We can see that the difference was skyhigh early 2008, and then crashed. It went even negative for a couple of days (not shown in the chart, as this chart shows monthly averages), meaning that at some point gold was more expensive than Platinum:

The second chart shows the Platinum-to-Gold ratio since 1968, and shows how many ounces of gold you can buy with one ounce of Platinum. From this perspective, it looks like the Platinum-to-Gold is very low at the moment, just like the article at BespokeInvest stated. However, this chart might be misleading, as the huge spike in 1968 takes away all the attention.

I therefore removed the data until 1971 in the following chart, which gives us a clearer image of the period from 1972 until today:
As we can see, the ratio was as low as 0.75 in 1982 and as low as 0.73 in 1985 (see the excel sheet for more detailed information).
The average ratio between 1972 and 2011 was 1.36. We can also see that the ratio found “support” at 1.00 a couple of times.

Can we detect bubbles using these charts? Maybe. Let’s check it out.

The Platinum-to-Gold ratio topped twice around 2.35: once at 2.34 in January 2001 and once at 2.31 in May 2008.
At both times, a major economic crisis followed, causing the ratio to drop sharply.
The ratio bottomed at 0.75 in September 1982, after the Gold bubble had popped a year earlier. So who knows, maybe this ratio might help us next time spotting a bubble?

Where are we now? Hard to say, although a ratio of 1 has provided support in the past.
If we use some imagination, we can see similarities between the early ’70s and today:

For people who want more information about why people invest in Platinum, I think this article from CPMgroup from 1995 might be an interesting read.


http://profitimes.com/free-articles/sell-silver-as-gold-ratio-pointing-to-slump-says-barratt

Gold & Silver – Deep Correction Due? – Part 2

Published : August 29th, 2011 by Julian D. W. PhillipsGold Forecaster
The rise in the gold price has continued and shown a break up above the trend line. This has always been a sign that the gold, silver prices have ‘spiked’. This has always been a signal to be ready to take profits and be ready to go back in lower down.
 

This was a correct approach and we do not argue with the logic; however, a change is happening in precious metal markets. Over the last few weeks gold has run ahead but it has seen brief and shallow corrections until this last week when traders and speculators caused a ‘spike’ to $1.910, before an equally dramatic fall back to $1,716.   This is not the sort of correction we are discussing here.  The speed and extent of the correction did not reflect the market fundamentals.


So we must ask, “Are the current buyers also potential sellers?” In developed markets, the concept that an investor will not take a profit once his target price is reached seems ridiculous because it is believed that all buyers will be sellers when they have a good profit. But in the changed gold market of today buyers are not often sellers, as we know it.


Does the Developed World Still Dominate Gold Prices?


The ongoing uncertainty in the developed world, the lack of political leadership over financial matters –Angela Merkel telling all that governments should not be told what to do by markets, still—and overwhelming debt in the face of further economic downturns, points to demand for gold coming from the developed world; however, gold demand is lackluster there, at best.


Developed world investors are asking themselves…


Will the developed world debt and distress factors pushing gold higher be put right?


Are these the factors that are pushing gold higher?


Are the gold and silver price rises just about the developed world and its problems?


Has gold seen its top?


By past measures the gold price looks as though it should have a deep correction. The same was said when gold hit $500 after rising from $300 too.


There has never been a more important time to understand both the gold and silver markets. Those who followed our Alert bought gold at $1,555 and are still holding gold. The table to the left is the most definitive piece of evidence describing what is happening in the global gold markets.


Gold Goes Global


Gold went really global around five years ago. In 2009 central banks came in as buyers. These two factors have changed the gold market entirely; they have distorted the factors bearing on technical analysis and changed the way prices move now. In fact, the very nature of investors in gold has changed, and for good!


Of course the market looks as though it needs a major correction, if you look at it through the eyes of six years ago. If you believe the picture painted by the old criteria, you should sell gold and stay out until it drops back, but to where?


If you understand the new investors and how they think, then your conclusions should be different. Look at what has happened since June and note that while the risks in the gold market have risen, current buyers are not price chasers either. This fact alone should make you ask,


Are they likely to be sellers because of a swift rise?


What we have seen is a failure to follow prices up, but to wait until they pull back and for physical gold to be on offer. The new investor wants physical gold itself and is not so concerned with price. If they are right, sooner or later the price will rise to well above what they have paid. The lifespan of their investment is generations long, not days, weeks, or years long.

The conditions that have lifted gold from $275 to $1,900 continue to persist. The gold price is not about gold; it is about the bear market in currencies, the deteriorating confidence in the value of currencies, as well as developed world’s government’s ability to restore that confidence.


As these factors point to more of the same –expect a continuation in the fall of currencies against gold and silver to levels deemed incredible by the developed markets of the world.


Do you expect the value of currencies to rise? Do you expect a resurgence of economic health in the developed world? Do you expect strong government with the force and conviction to produce a reformed strong monetary system across a financially united world?


Asian View of Money


Asia has always had an inherent trust in precious metals; a trust, which has now been validated again and again over the last decade.  


Asian investors have never believed that paper money is a solid measure of value. When they see currencies weaken it is in line with the nature of governments. Is there a government whose money has lasted throughout its entire lifetime? When there has been, its money was gold and silver, and such money has lasted throughout most governments in history. Now, has there been a paper money based on a government’s obligations that has lasted beyond the life of the government?


It is this perspective of money that is critical to understanding

today’s gold and silver markets.


There is a point where confidence in paper money has sunk so low that a collapse is triggered. Governments will fight tooth-and-nail to prevent that from happening. When it does happen, it happens as fast as rebels entering Tripoli.


Central bank’s investment in gold is an insurance policy against such a collapse. People who have never been lulled into the developed world’s sophisticated monetary systems are not likely to be so, now that it looks so wobbly. The rise of gold and silver prices is about the fall of paper money.

http://www.24hgold.com/english/contributor.aspx?langue=en&article=3611713272G10020


Why Gold and Silver Prices Will More than Double Again Even From Current Prices

JS Kim  August 4th, 2011

Those that are familiar with my writings about gold and silver for the last six years know that I have said gold was cheap at $500, $600, $700, $800, $1000 and $1,200 a troy ounce and know that I have said silver was cheap at $11, $12, $14, $16, $25, and $30 a troy ounce. Today, I will reiterate that gold is still cheap in the $1500 to $1600 range and that silver is still cheap in the $40 range because the largest movements in gold and silver prices as well as gold and silver mining stocks have still not happened and will materialize over the next four to five years. Again, this doesn’t mean that gold and silver can’t or won’t correct or consolidate again in the future because both PMs always do. I have written publicly so much about this topic over the years (and even in much greater depth to my subscribing members) because I truly believe it is insanity not to participate in one of the best ways to invest in gold and silver today – the ownership of physical gold and physical silver.


Hundreds of millions of investors worldwide, influenced by the propaganda of Western bankers, have consciously made poor decisions not to own a single ounce of physical gold and physical silver today. One of the first realities an investor must understand about the gold and silver market is that the Economics 101 concept of price being set by physical supply and physical demand is an utter lie.  In today’s world of banking and financial industry lies, the price of gold and silver are NOT set by the physical demand and physical supply of either of these metals, but rather by the artificial supply and demand of paper contracts predominantly backed by no physical metal.


By now, the following facts are very well known by seasoned physical gold and physical silver buyers but likely still unknown to the average investor worldwide. A CPM Group document released in the year 2000 stated, “With the start of the London Bullion Market Association’s release of monthly trading data, the market has become aware that 100 times more gold and silver trade hands each year, just in the major markets, than is produced or used. Some market participants have wondered aloud how 10 billion ounces of gold could trade via the major markets each year, compared to 120 million ounces of total supply and demand, while roughly 100 billion ounces of silver change hands, compared to around 628 million ounces of new supply.”  Thus, one can see that the fraud perpetrated by bullion banks in the silver futures market exceeds even the fraud they commit in the gold futures markets.  Take the figures provided above, and a quick calculation reveals that bankers were trading nearly 160 times of paper ounces of silver every year than the annual physical supply of silver mined from the earth.


However, break down these numbers even more and the fraud becomes even more astounding.  While in 2000, about 628 million ounces of new supply of physical silver came to market, in 2010, mine production of new silver supply was slightly higher at 735.9 million ounces. Net government sales accounted for another 44.8 million ounces, old silver scrap provided an additional 215 million ounces, and producer hedging accounted for the final 61.1 million ounces. Thus a total annual supply of roughly 1 billion ounces of silver existed in 2010.  However, industrial usage, photography and jewelry used up nearly 78% of the one billion ounces of physical silver supply in 2010 and left less than 100 million ounces available for minting in the form of silver coins. (Source: The Silver Institute). Despite this tightness of new investment silver supply, there have been days in recent months when more than 250 million ounces of paper silver traded on the COMEX in less than one minute! During the times ridiculous volumes of paper silver were trading on the COMEX, usually the price of silver was plummeting in intra-day trading. Thus, bankers were clearly using this massive artificial supply of paper silver contracts to knock down prices.  On top of this fraud, bankers have stretched the landscape of imaginary supply of gold and silver with their introduction of the gold ETF, the GLD, and the silver ETF, the SLV, both of which started trading in 2006. Both the GLD and SLV are highly suspect, likely fraudulent vehicles that probably are either (1) only partially backed by physical gold and physical silver and/or (2) respectively backed by unallocated physical gold/silver that have multiple claims upon them. Again, fraudulent derivative paper gold and paper silver products create a perception of increased supply even when there is no REAL increase in the underlying physical supply or even at times when physical supply is shrinking. Bankers have created this mechanism specifically to suppress the price of gold and silver and to keep their Ponzi fiat currency scheme alive – a scheme that they utilize every single day to silently steal wealth from every citizen on this planet.


I have heard the criticisms levied against Eric Sprott and James Turk regarding their pro-silver and pro-gold stance in that they are just selling their books as PM fund managers and bullion dealers. However, I believe these criticisms to be patently unfair. I don’t believe that either Mr. Sprott or Mr. Turk are so enthusiastic about the future prospects of gold and silver returns because they just want to “talk their books”. Rather, I believe that they are so enthusiastic due to their deeper level of understanding about PM markets than the average retail investor and the vast majority of uneducated commercial investment industry advisers. Furthermore, I’ve been one of the most passionate supporters of gold and silver for the last decade and I have never acted as a bullion dealer, have never received any commissions from any sales of mining stocks, and have never accepted a single cent from any mining company to provide coverage of their company to my subscribing members though I have been approached many times to do so over the years.


To illustrate the level of misunderstanding that still exists about gold and silver prices, here’s one piece of investment “advice” that landed in my email inbox on August 16, 2008: “The barbarous relic – gold – is another good choice, usually. But gold has already appreciated from just over $300 an ounce six years ago to almost $900 today. It could be a little late.” This adviser went on to push stocks and confidently declared that stocks would be the “big winner” once again over the next several years. From August 16, 2008 until today, the S&P 500 has lost 2.92% while gold has risen +111.33% and silver, +284.47%. Stocks, the big winner? I think not. But selling stocks is the big bread and butter money winner of most commercial investment advisers so that is the primary reason why they overwhelmingly always push their clients into purchasing stocks as opposed to the real big winner of precious metals. I recall reading a newspaper article several years ago from a financial adviser in Florida that claimed she was proud of convincing here clients NOT to buy gold at $800 an ounce because the gold price was too expensive and that it was her duty to protect her clients against their own foolish impulses. On November 8, 2007, thousands of people that subscribe to my free newsletter read the following statements from me:


“So with gold over $800 an ounce, is it still cheap? Emphatically yes, and here’s why. I’m not really sure how all the ‘Gold at 27-year high’ headlines came to be, but… if we experience a correction any time soon, and gold breaks back down to the $720 level again before continuing higher, it will just be really cheap. Here’s why. Anyone that’s ever studied the formula that is used to calculate the Consumer Price Index(CPI)  in the U.S. knows that the formula has been greatly tinkered with over the years to produce absurdly low inflation numbers that are merely an artificially manufactured number that probably fits some pre-determined number the government would like to report.”


So back then, even with gold trading at $800 an ounce, the banker-owned and controlled media in the Western world was filled with stories about an imminent “gold bubble” collapse because gold was at a “27-year high.” It’s important to review history from time to time to be reminded how easily you may have accepted patently absurd proclamations about gold and silver prices in order to avoid falling victim to the same banker-originated and banker-spread propaganda today.  The reason I have been overly passionate about gold and silver for years and still am today is because it takes great passion to overcome the widespread ignorance and deceit spread by the commercial investment industry to their clients about gold and silver.


Let’s see how things have panned out in the stocks versus PM investment game over the past few years. From the launch of my Crisis Investment Opportunities newsletter on June 15, 2007 until July 25, 2010, in a little over four years, my newsletter has returned a cumulative profit of  +211.49%. Over the same investment period, the S&P500, the FTSE100, the ASX200, and top 5 ETF iShares Dow Jones EPAC Select Dividend Fund have respectively returned  -21.39%, -11.99%, -26.51%, and -2.69%. Furthermore, during the next four year period, from 2011 to 2015, I truly believe that an attainable goal for my Crisis Investment Opportunities newsletter is to double or even triple my previous four-year cumulative returns, simply due to the following three reasons:


(1) Western bankers are increasingly losing control over the price suppression schemes they have enacted against gold and silver through their creation of bogus paper derivatives;

(2) The conditions that have lead to Euro and US dollar devaluation are worse today than they were 10 years ago and no underlying fundamental problem of the 2008 financial crisis has been adequately addressed as of today; and

(3) The percentage of people that have the amount of faith I hold in gold and silver to produce superior returns around the world is still minute.

Thus, once the average Dick and Jane retail investor finally believe in the facts surrounding gold and silver versus the garbage propaganda disseminated by crooked bankers and ignorant advisers, the price of gold/silver and PM stocks will finally experience a truly parabolic rise.


Once a small percentage of retail investors worldwide, or even just a small percentage of retail investors in a densely populated country like China, finally realize that bankers have created insane massive paper supplies of artificial gold and silver backed by nothing but air and are consequently moved to purchase their first troy ounce of pure gold and/or pure silver, this very small action will exert tremendous upward pressure on the price of gold and silver. And once this happens, I hope that you will have already secured your physical reserves of gold and silver because it is then that PM prices will truly go ballistic.


About the author: In 2005, JS Kim walked away from the immorality of Wall Street to form his own fiercely independent investment research & consulting firm, SmartKnowledgeU. Freed from the deceit and massive restrictions of the commercial investment industry, JS has been guiding clients towards significant profitability ever since. Currently, JS is working on completing two short books that explain the fraud of the modern banking system in simple terms and plans to donate 100% of all profits from these books to orphanages in S. Africa, Vietnam, and Thailand. Visit us at http://www.smartknowledgeu.com to be informed of their release andFollow us on Twitter.

Republishing Rights: This article may be reprinted as long as the author acknowledgment and all text and links remain intact above. We have noticed that other sites have recently reprinted our articles with no author acknowledgment and in violation of our republishing guidelines. We will ask all sites to cease printing any of our articles that do not abide by our republishing rules. Thank you.


http://www.theundergroundinvestor.com/2011/08/why-gold-and-silver-prices-will-more-than-double-again-even-from-current-prices/

Gold Fundamentals 2

Adam Hamilton | Fri, Dec 26, 2008

Gold belongs in every investor’s portfolio. It is totally unique among financial assets, a physical metal commanding timeless and universal intrinsic value. It is a rock of stability in a chaotic world, a stark contrast to the complex web of mere promises to pay that is our modern faith-based financial system. Without gold, true diversification and protection from systemic risk is impossible.

Gold’s fundamentals are dazzlingly bullish. Like everything else on the planet that is freely bought and sold, gold’s price today and in the future is a direct function of its supply and demand. As long as its global demand exceeds its global supply on balance, gold’s price will continue powering higher in its secular bull. While it has already come far from its humble beginnings in the $250s in April 2001, it has a long way to run yet.

When I first started recommending physical gold coins to our subscribers in May 2001 in the $260s, gold was widely derided as an anachronistic relic. Not surprisingly after nearly quadrupling in the years since, it has earned vastly more respect today. Still, most mainstream investors have yet to understand gold’s bullish fundamentals so unfortunately they are missing out on the vast opportunities to come.

It is for these gold neophytes I am penning this essay. I will explore gold’s key fundamental drivers, both from the supply and demand sides. After you digest this high-level overview of gold’s fundamentals, you’ll have a much better idea of whether you should add some gold to your own investment portfolio. In order to streamline the enormous body of research underlying this effort, I’ve divided this essay into sections.

Supply – Mined Supply. Ultimately all gold is painstakingly chiseled from the bowels of the earth. But even with the best modern mining technology, this rare metal is still exceedingly hard to produce. Today’s gold miners face nearly insurmountable challenges on a myriad of fronts. It is really a wonder that any gold is produced at all when you consider just how difficult it is to bring new supplies to market.

First explorers have to find gold deposits. This isn’t easy. Not only is gold very scarce in the natural world, but prospectors have been scouring the planet for millennia looking for it. Most of the low-hanging-fruit gold deposits have probably already been found. It costs millions to explore, with very high odds of failure. And if a promising ore target is found, tens of millions more must be spent to drill and sample it to determine if it is economically viable. This risky exploration and proofing process takes years.

And once a deposit looks economically viable, the real fun begins. Miners must spend years more developing a mining plan and having it approved by various government authorities. At any stage in this long arduous journey, the government can torpedo the whole project resulting in a total loss. Unlike most businesses, mines cannot be moved when problems arise. So gold miners are totally at the mercy of corrupt bureaucrats. Extortion is common and even outright nationalization is a very real threat in many parts of the world. Radical fringe environmentalists constantly try to derail mining projects too.

After the government permits are obtained, construction must begin. This costs hundreds of millions, sometimes well over a billion, in today’s environment. Since gold mining is so risky the banks are often unwilling to loan money to miners, and if they do they demand onerous terms. So the companies have to issue shares in the equity markets to finance these projects. While financing was already difficult to obtain before the credit crisis and stock panic, many miners today are finding it impossible to come by now. Without financing, mines cannot be built.

Even if a miner somehow overcomes the long odds and brings its mine into production, often a decade after the deposit was first found, more challenges await. Even with extensive drilling before mining, the geology of the ore can vary dramatically from plan. This results in lower production, higher costs, and lower profits. Since gold is often only found in hostile climates today, bad weather can interfere with production in a variety of ways. Friendly governments can be usurped by unfriendly ones, raising the risks of crushing taxes or even confiscation.

For these reasons and many more, global gold production is actually falling despite the relatively high gold prices. Annual gold mined today, which is 70% of the world’s supply, is running over 4% lower than when this bull began in 2001! Global reserves are also shrinking, despite vast sums being spent on exploration. My business partner Scott Wright recently wrote an excellent essay, with charts, on worldwide gold production and reserves if you want to dig deeper. Despite this powerful gold bull, miners are falling farther behind.

With mined gold supply heavily constrained despite the best efforts of the world’s elite miners and the strong gold-price incentives to produce, any demand growth cannot be satiated with mined gold. And even if gold mining somehow becomes easier (geopolitics are less hostile, for example), it will still take the better part of a decade before new supplies can be brought online. This is incredibly bullish for gold!

Supply – Central Bank Sales. Over centuries, central banks have accumulated vast hoards of gold bullion. Some of this was purchased righteously, but much was obtained via plunder and confiscation. Central banks as a group are the largest participants in the gold market. Thus they have become something of a bogeyman in the gold world. Many investors live in constant fear of future central-bank gold sales.

Seven years ago when gold was under $300 central banks made me anxious too. But they don’t any longer. Despite the mystical aura of dread surrounding them, they are merely gold investors like me. While their collective scale is very large, these behemoths are run by mere mortals who cannot see the future either. Whether buying or selling gold, central banks operate within the same market constraints as the rest of us.

In the entire history of the world, analysts estimate that about 162,500 metric tons of gold have been mined. Incidentally gold is so dense that a metric ton of it will fit in a solid cube less than 15 inches square. Thus all the gold ever mined anywhere would fit in a cube less than 67 feet per side! Of this global above-ground gold supply, as of Q3 2008 the world’s central banks held 29,784t. Thus the CBs control just 18% of the world’s total above-ground gold. Investors control a far-greater 82%.

Since this gold bull began in 2001, mined production has averaged about 2,500t per year. So if the world’s central banks decided to sell all their gold today, it would be like 12 years of production hitting the markets all at once. The gold price would utterly crash in such a scenario, it would be apocalyptic. Thankfully it will never happen for a wide array of reasons. First, 107 sovereign countries own this gold and they are never all going to agree on anything, let alone a coordinated gold dump.

Of this 29,784t of official gold holdings, 8,134t (27%) belongs to the United States. Many gold conspiracy theorists believe a big fraction of this gold has already been stealthily sold into the marketplace. This is very bullish if true since it reduces the threat of future sales. Even if the US still holds this gold though, the US dollar would probably collapse if an announcement was made that the US was dumping its gold reserves. It is extremely unlikely. 10,911t (37%) of this CB gold is held in the Eurozone, and this gold is a very high percentage of these countries’ total foreign-exchange reserves (58% in aggregate).

So European CBs have been selling gold aggressively to diversify since at least 1999. That year they met and formed what was later called the Central Bank Gold Agreement. They agreed to limit their collective gold sales to 400t annually over 5 years. In March 2004 in CBGA 2, this agreement was extended and expanded to a 500t-per-year maximum for another 5 years. While these targets haven’t always been hit in a given CBGA year (ending September), they are a good proxy for European CB sales as a whole.

Since 2000, European CBs alone have sold between 400t to 500t of gold annually. These are indeed big numbers, adding 16% to 20% to the global mined supply. Without these sales, gold’s price would have gone much higher. But even with them, gold has still nearly quadrupled since early 2001! This means even heavy sustained CB selling is not big enough to offset the growing investment demand for gold. So far in this secular gold bull, despite the CBs’ giant selling campaigns, gold has still powered higher.

Central banks are not an apocalyptic threat for gold. Every year European CBs sell gold, which makes their “market share” of total above-ground gold dwindle. And every year more gold is mined, farther reducing CBs’ relative footprint in the gold world. Thus with each passing year, with every tonne of CB gold sold, central-bank impact and relevance in the gold market gradually fades. They are nowhere near as big of threat today as they were in 2001 and with each passing year their positions continue to weaken.

And not all central banks are sellers. 10,739t (36%) of CB gold is held outside of the US and Europe. These Asian central banks will probably increasingly buy physical gold bullion. While western CBs’ gold holdings generally represent 50% to 75% of each country’s total forex reserves, in Asia gold is just a few percent. Japan’s 765t of gold are just 2.1% of its forex reserves. China’s 600t are merely 0.9%. Russia’s 473t are only 2.1%. And India’s 358t account for a paltry 3.1%. These growing Asian giants need to diversify into gold, not out of it like the Western CBs. They will add to overall global investment demand.

The International Monetary Fund holds 3,217t (11% of official gold). Potential IMF gold sales are a perennial threat trotted out every few years to scare gold investors. Even back in 2001 IMF sales were discussed often, yet big IMF selling has still not come to pass in the 7 years since. Even if the IMF can get permission from its 185 member countries to sell gold, which is very unlikely for political reasons, the IMF gold cannot stop this secular gold bull. Bring it on, the Asian CBs would love to own the IMF gold.

At any rate, the key thing to remember about central-bank gold sales is they have been large and constant since gold was in the $250s. Yet even with this supply headwind, gold still nearly quadrupled to just over $1000 by early 2008! Even the worst that central banks could throw at gold wasn’t enough to seriously retard its secular bull. And with each tonne they sell, their relative share of above-ground gold (along with their relevance) dwindles. CB gold is finite. It is central banks that are the anachronism, not gold.

Demand – Investment Demand. With mined supply shrinking and central bank hoards dwindling, gold supplies are very constrained. And no matter how high the gold price goes, mining is not going to get much easier and in fact will probably continue to get more difficult. And central banks are not going to be able to conjure up more gold out of thin air like they do with their fiat paper currencies. With flat-to-shrinking supplies, demand is the wildcard that will drive gold prices in the coming decade.

Unlike all other commodities which are primarily used for industrial purposes, almost all gold demand is investment-driven. Gold’s intrinsic value has persisted for millennia, outliving every government, currency, and nation the world has ever seen. Gold is not a faith-based promise to pay like every other financial asset. Its innate value makes it easily negotiable, for anything anywhere, no matter what happens. Physical gold bullion should be the foundation of every investor’s portfolio.

All the demand categories below are subcategories of investment demand. For a broad array of reasons today, all kinds of investors all over the world are increasingly interested in gold investing. And in the financial world, the higher the price of anything goes the more people become interested in it. Performance and returns attract in capital, which creates a virtuous circle driving even higher prices. So a secular gold bull gradually becomes a self-fulfilling prophecy until supply once again eclipses demand.

Demand – Monetary Inflation. Inflation is always and exclusively purely monetary in nature. When central banks create fiat money out of thin air, it eventually filters into the real economy to compete for finite goods and services. Relatively more money bidding on relatively less goods and services means higher general prices. Inflation is devastating for investors, an immoral stealth tax levied by corrupt governments. Gold is the only financial asset that thrives in inflationary times.

And boy are we seeing inflation today! The socialistic financial-market bailouts, which now exceed $8 trillion in the US alone according to Bloomberg, are the biggest single inflationary event the world has ever witnessed. During the Great Stock Panic of 2008, within a matter of months Washington and the Fed inflated, spent, or guaranteed the equivalent of 55% of the entire GDP (all goods and services produced annually) in the whole United States of America!

This near-hyper inflation alone is exceedingly bullish for gold. But unfortunately central banks relentlessly inflating their money supplies is not an isolated event reserved for crises. They are always doing it! Since January 1980, the US Federal Reserve has grown MZM money by an astounding 10.4x! There are an order of magnitude more dollars floating around the world today than 3 decades ago. This equates to an 8.7% compound annual growth rate over 28 years.

This wouldn’t be a big deal if the underlying economy grew by 8.7% a year as well. If the pool of goods and services on which to spend money grows as fast as the money supply, there is no inflation. But obviously this is not the case. Since January 1980 US nominal GDP has only grown by 5.3x, only about half as much as the money supply. And the Fed is not alone here, all over the world broad money supplies in first-world nations generally average growth rates of around 7% annually.

At 7% annual growth rates globally, there is 6.6x more paper money in circulation today than there was in early 1980 at the top of the last secular gold bull. Yet over centuries, new mining has only added 1% to 2% to the aboveground gold supply annually. At 1.5% gold growth through mining each year, today’s gold supply is only 1.5x as big as 3 decades ago compared to 6.6x for money. Divide this out and there are 4.4x as many fiat-currency units (dollars, euros, everything) potentially chasing each ounce of gold today than at the end of the last gold bull!

If you multiply the famous $850 nominal high of January 1980 by this 4.4x outpacing of gold growth by monetary inflation, it yields a conservative end-of-bull target approaching $4000 per ounce. If you adjust by the lowballed Consumer Price Index instead, the real gold high in January 1980 in today’s dollars ran up around $2400. Either way, today’s gold bull has a long way to run before it reflects today’s inflation, let alone future inflation. Central banks’ only real ability is to inflate, inflate, inflate into infinity.

So monetary inflation is not going away. If anything it will only accelerate. In a fragile debt-based highly-leveraged global financial system, inflate or die is a literal truth. If central banks don’t keep inflating at ever-expanding rates, the whole worldwide system will implode. This perpetual accelerating fiat-paper inflation is unbelievably bullish for gold. As investors worldwide become more aware of the incredible monetary inflation around them, their appetite for gold investment will only grow.

Demand – Negative Real Interest Rates. When central banks are running their printing presses overtime and inflating like mad, nominal interest rates (yields on bonds) can slide below the rate of inflation. When this happens real inflation-adjusted interest rates go negative. In other words, merely by owning the best elite bonds like US Treasuries bond investors actually lose real purchasing power year after year! Naturally bond investors aren’t in the game to lose money, so negative real rates infuriate them.

Unfortunately just like the old Soviet Politburo, today’s central banks actively manipulate short-term interest rates. As we’ve seen in recent months, central banks can drive nominal interest rates down to zero if they desire. This abominable power is unbelievably destructive to free markets. It destroys the necessary natural balance between savers (investors) and debtors. And when capital transactions are no longer mutually beneficial to both parties, investors gradually start to walk away.

Thus negative real rates slowly strangle the life out of the bond markets. Bond investors, tired of being punished by the central banks for their act of saving and forced to subsidize debtors, gradually withdraw their capital. It is foolish to invest in a realm where you are guaranteed to lose real purchasing power for investing your scarce capital. Some fraction of this bond flight capital seeks refuge in gold. While gold doesn’t pay a yield, over millennia it has never failed to at very least keep pace with monetary inflation and preserve purchasing power.

And in today’s crazy environment of near-zero nominal yields on even US Treasury debt, mainstream bond investors’ traditional argument against gold is rendered moot. In normal times of positive real rates, the way the markets would always work without central-bank interference, bond investors object to gold because it pays no yield. Well, today bonds pay virtually no nominal yields either! And after inflation their real yields are terribly negative. This makes gold very attractive to mainstream debt investors.

Thus negative real rates, inflation exceeding nominal bond yields, is the most bullish possible monetary environment for gold. A couple weeks ago I wrote an essay on real rates and gold that includes long-term charts if you want to dig deeper into this crucial truth. Until the goofy Fed raises interest rates radically, say to 6%+, real rates will remain too low or negative and very bullish for gold. And as you know, there isn’t a snowball’s chance in hell that the cowardly Fed will push rates to 6%+ for many years to come, if ever.

Demand – Secular Dollar Bear. The central banks’ artificially-low interest-rate policies to subsidize debtors and punish savers wreak terrible collateral damage on currencies. The global currency markets are often driven by yield. If one first-world country’s bonds are yielding 2% while another’s are yielding 4%, currency investors and speculators will naturally gravitate to the higher yields. So today’s ludicrously-low US interest rates are ravaging the already-weak US dollar.

Once the world’s reserve currency, the mighty US dollar has been in a secular bear since mid-2001. As measured by the flagship US Dollar Index (a basket of major currencies), the dollar carved a series of new all-time lows in spring 2008. The long-term dollar charts show just how weak this currency has been, down 41.0% at worst in its secular bear to date. And this was all well before Ben Bernanke panicked and forced US interest rates to all-time lows near zero!

Today’s deeply negative real-rate environment will only strengthen and prolong the secular dollar bear. As the long-term USDX charts clearly reveal, the US dollar is always weak in a secular sense when real rates are too low or negative. A weaker dollar drives all kinds of investment interest in gold, from two major constituencies. Since gold is ultimately another currency, the only hard one on the planet, futures traders buy gold aggressively when the dollar sells off. A continuing dollar bear will drive major futures buying in gold.

Even more importantly, large foreign investors including central banks have far-too-much dollar exposure relative to their overall portfolios. This great overallocation was fine when the US dollar was in a secular bull in the 1990s. But these investors have already lost a fortune in the 2000s dollar bear and they will lose a lot more if this bear continues and they don’t diversify out of their overweight dollar holdings. While they will buy a lot of euros with their dollar sales, some major fraction will flow into gold.

The biggest buyers of gold to protect themselves from the ongoing dollar bear will be the Asian central banks. As mentioned above, they now have trivial fractions of their total forex reserves deployed in gold. Yet they have trillions of dollars worth of exposure in US dollars and US Treasuries, from 50% to 80% of their total reserves in falling US dollars! Asian CB diversification out of dollars into gold is mind-blowingly bullish for this metal.

At $800 per ounce, the 2500t of new gold mined each year is only worth $64b. If Asian central banks gradually move $1t (not even half of their US dollar reserves today) into gold in the coming decade, it would represent buying equivalent to almost 16 years of total world gold production! So the secular dollar bear, exacerbated by the Fed’s asinine 1970s-style negative-real-rate policy, is highly likely to spawn big CB gold buying out of Asia for diversification reasons. The ongoing dollar bear is very bullish for gold investment demand growth.

Demand – Secular Stock Bear. Bond investors, futures traders, and Asian central banks are not the only giant pools of capital that have huge incentives to invest heavily in gold today. So do stock investors. As I started warning about back in 2001, after the giant secular bull that peaked in early 2000 the US stock markets were due for a 17-year secular bear. This means 17 years of grinding sideways on balance, never heading too far above the 2000 highs over this entire multi-decade span.

These secular bears that occur after secular bulls are part of a great valuation-driven cycle in the stock markets that I call the Long Valuation Waves. The LVWs are the single most important force for long-term stock investors to understand, so please read my essay on them if you are not familiar. Since 2001 this analysis has proved dead right, even though most investors and analysts scoffed at it. I even used LVWs to warn about the S&P 500 getting cut in half back in January 2008 well before the recent stock panic.

Because we are indisputably in the secular-bear stage of our current LVW, the stock markets are likely to grind sideways for another 8 years or so. The last time a 17-year secular-bear hit the US stock markets, between 1966 and 1982, stock investors were flat on paper but they absorbed tremendous real losses after inflation. Realize that big 100% cyclical stock bulls are still possible and probable within these secular bears, but when all is said and done stocks will have merely ground sideways for nearly two decades.

As stock investors come to grip with this ugly reality, they will get more and more discouraged about general stocks. Kind of like negative real rates’ impact on bond-investor psychology, stock investors are going to increasingly realize how silly it is to stay heavily deployed in flat-trending stocks and suffer heavy real losses. Some fraction of these beleaguered stock investors will turn to gold for deliverance.

Between March 2000 and November 2008, the flagship S&P 500 US stock index lost a sickening 50.7%. Yet over this same span to the very day, gold soared 161.0% higher! Wouldn’t you have much rather been in gold since then, like we contrarians have? And if you instead optimize this span for the secular gold bull rather than the secular stock bear, it looks even better. From April 2001 to March 2008, gold soared 291.7% higher. Over this identical 7-year span the SPX was merely up 11.4%.

As mainstream stock investors start to better understand gold’s fundamentals, more and more of their massive pool of capital is going to flood into gold. Indeed this is already happening through the new gold ETFs. These exchange-traded funds act as a conduit between stock-market capital and the physical gold market. In fact, the GLD gold ETF in the US (the world’s largest by far) has grown its holdings from nothing to 775t held in trust on behalf of US stock investors in just 4 years! This single ETF now holds more gold than all but 6 of the world’s biggest central banks!

Demand – Secular Commodities Bull. During the secular stock bull from 1982 to 2000, capital was increasingly seduced into the stock markets to chase the phenomenal returns. This led other sectors to be starved for investment, particularly commodities. Thus global commodities-producing infrastructure was largely left rusting for the better part of two decades even while worldwide economic activity ramped up dramatically. This chronic underinvestment in supply and delivery infrastructure led to this decade’s great commodities bull.

Despite the brutally fast and large correction in commodities since July that was greatly exacerbated by the stock panic, these secular commodities bulls aren’t over. They tend to run 17 years on balance in history, with inverse phases to the stock LVWs. When stock markets are in secular bulls, commodities are in secular bears. And when stocks are in secular bears like today, commodities are in secular bulls.

Secular bull markets can’t end until global supply growth exceeds global demand growth. This has yet to happen in nearly all major commodities. No matter how high prices go, as gold mined production illustrates, commodities producers just can’t adjust fast enough to meet demand trends. It takes years to over a decade to find new supplies of raw materials and bring them to market. This inherent inelasticity of commodities supplies is what makes commodities bull markets so exciting and exceedingly profitable.

On top of today’s demand, half the world (primarily Asia and Africa) is now industrializing. Billions of people are working incredibly hard to increase the standards of living for their families. And as standards of living rise, absolute commodities consumption will skyrocket. Sure, the average Chinese or Indian is never likely to consume as much per-capita as we Americans are blessed to do today. But since they are starting from such low levels, and since there are billions of Asians, even if they ultimately get to 1/5th the per-capita levels of US consumption of major commodities then aggregate global demand will explode.

As this commodities bull powers higher worldwide, gold will get increasing attention from investors. While gold is not the king of commodities like oil, gold is the easiest and most logical way to invest in commodities. It is easily bought and sold, extremely valuable for its volume and weight, completely portable, and very easy to store. So as the global commodities bull reemerges from this severe correction and powers higher, untold hundreds of millions of investors worldwide will start adding gold to their portfolios.

Demand – Rise of the Asian Consumer. We’ve already discussed Asian central banks needing to diversify their dollar-dominated forex reserves into gold. But another huge source of future investment demand is going to be from average Asian consumers. Unlike Americans and increasingly Europeans, Asians have a deep cultural affinity for gold. They have always respected it and want to own it even when it is not performing well. They understand from painful historical experience how physical gold protects them from corrupt governments, paper currencies, and unforeseen financial disruptions.

As the industrialization of Asia (and Africa) makes consumers more affluent, they will demand much more gold investment. Asians tend to be big savers (investors) even in lean times, and as their incomes grow they will have larger surpluses available to invest after living expenses. There is no doubt a big fraction of these surpluses will buy gold. While each Asian won’t be able to afford much by Western investors’ standards, with billions of them the aggregate increase in gold demand will still be stunning.

And Asian stock markets weren’t immune to the recent stock panic. In fact, they fell more violently than the US markets in many cases. Gold denominated in other currencies did far better in the global stock panic than it did denominated in US dollars, approaching all-time highs in some cases. So the new Asian investing class, terribly shaken by the stock-market carnage, is now more likely than ever to diversify some of its capital into gold.

Over the coming decade, the rise of the Asian consumer/investor could be more bullish for gold investment demand than all the other demand factors combined. Asian investment demand barely existed during the 1970s gold bull, yet that bull was still huge. Imagine how big today’s will ultimately prove with Asia finally on board.

Suppy and Demand – Technical Proof. There are many other secondary factors likely to increase global gold investment demand. The Information Age is an example. During the 1970s gold bull, Wall Street hated gold just like it does today. So back then many investors couldn’t learn about gold because the mainstream media monopolized information flow. Lack of widely-available good analysis on gold retarded that famous gold bull, which was still very large (+2,332%!).

But thanks to the Internet, the mainstream media’s stranglehold on information has been shattered. Today anyone anywhere can easily learn about gold fundamentals. This is very bullish for gold. Thanks to the Internet, today any investor can order physical gold coins in a matter of minutes that will be delivered to his doorstep a few days later. Thanks to computers, today stock investors who wouldn’t bother with gold coins in a million years can buy a gold ETF in seconds to add gold exposure to their portfolios. We live in a wondrous era!

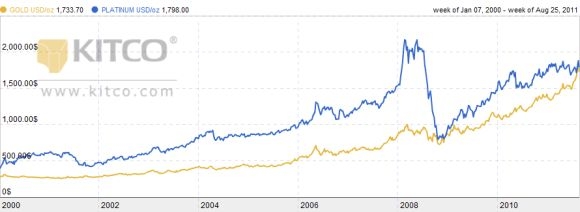
Ultimately though, the proof of this gold bull is in its secular chart. The path gold has carved here is the aggregate result of every ounce of gold bought or sold on this planet since 2001. Every central bank sale is reflected here. Every gold investment made by individuals and institutions is reflected here. Every sale of gold, whether to fund a kid’s college education, buy a house, or whatever, is reflected here. This chart is the distillation of all global supply and demand for gold. And its message is crystal clear.

Since early 2001, gold has nearly quadrupled at best. It has relentlessly carved higher highs and higher lows on a secular basis. Its dollar price has increased every single year (the green numbers on the bottom show the amounts). The only way such results are possible is if global demand growth has indeed exceeded supply growth since 2001. I challenge you to find another investment that can even approach such performance in the incredibly chaotic markets we’ve witnessed over the last 7 years. Gold is already in an elite class of its own.

At Zeal we’ve been long physical gold since it traded in the $260s in May 2001. Our subscribers have already made fortunes in the 7 years since heeding our analysis and recommendations. So we are certainly not new to this gold party, we were buying gold and gold stocks back in the early 2000s when it was considered lunacy to do so. We are true contrarians who have been battle-tested, and prevailed, in this challenging financial decade.

We are going to work hard to continue excelling in the next decade, capitalizing on the ongoing gold and general-commodities secular bulls. We publish acclaimed weekly and monthly newsletters that detail our market analysis on an ongoing basis and the real-world trades we are making based on it. Subscribe today!

We also just finished a deep new 36-page fundamental report on our 12 favorite gold stocks, the result of hundreds of hours of research looking at all the world’s publicly-traded primary gold producers. As gold powers higher, gold stocks should continue to leverage its gains. Buy our new report now while these stocks remain at bargain panic-driven prices!

The bottom line is gold’s fundamentals are more bullish today than ever. Despite relatively high prices, mined supply is shrinking. Central banks’ relative power in this market is waning dramatically. And thanks to both natural market forces and artificial manipulation contrivances, global investment demand for gold is likely to grow tremendously from today’s levels. This secular gold bull is far from over friends!

http://www.safehaven.com/article/12167/gold-fundamentals-2

Gold on verge of major correction?

David Banister – August 23rd, 2011

Just under two weeks ago I wrote about gold likely running to a final top with various levels ranging from 1862 to 1907 per ounce as likely. So far, we bottomed with a pivot at $1730 which I mentioned to my paying subscribers and we have run to as high as $1898 per ounce counting futures trading on August 22nd. What should we expect now as the most likely intermediate trading pattern for Gold?


Clearly, Gold is overbought on traditional technical measures such as RSI, MACD, and Moving Averages and more, so that is one warning flag. To wit, Gold historically pulls back pretty aggressively anytime it has run much above its 20 week EMA line. On a daily chart that stands at about $1730 per ounce, and on a weekly chart around $1580 per ounce. This week marks Fibonacci week #8 from the 1480 pivot lows of a wave 4 pattern I outlined for my subscribers as likely to turn gold higher to 1730 plus. In addition, we are 34 Fibonacci months into this 5 wave Bull Run from the October 2008 $681 lows.


I use Elliott Wave Theory combined with sentiment indicators and other measures to help determine major buy and sell pivots for Gold, and this methodology has been extremely accurate and successful for years. Right now I can count Gold as coming into a final 5th wave thrust to all- time highs with sentiment running at huge extremes and technical patterns screamingly overbought. This action in Gold over the last many weeks reminds me of the final blow-off top of the NASDAQ in 2000 as it ran from 4000 to 5000 in a few months and exhausted the buyers. This 5 wave pattern began 34 months ago and the final 5th wave usually drags as many taxi cab drivers onto the back of the Bull just in time to dump them off with a bag in their hand and no ride.


The bottom line is Gold is in a 13 year upwards cycle, and we are in about year 10 and it’s due for a likely pause in the uptrend, and certainly a correction of 10-15% would be normal in any massive bull cycle to kick all the bulls and latecomers off the back of the charging Bull. This pause should be a Primary wave 4 consolidation, where 2 and 4 are corrective and 1, 3, and 5 are bullish cycles.


Below is the latest chart on gold, not counting the overnight $1898 highs last night, but you can see that Gold is above the normal pivot high lines where we have seen major corrections over the past 34 month up cycle. A major parabolic blow off rise is of course possible, but hedging long positions and or considering shorting gold for the more aggressive players is advised:


Consider joining us at TMTF for forecasts and tradable pivot ideas on the SP500, Gold, and Silver with stunning accuracy. Check us out at www.MarketTrendForecast.com for a 33% discount coupon or to sign up for occasional updates.

http://www.24hgold.com/english/news-gold-silver-gold-on-verge-of-major-correction-.aspx?article=3608297260G10020&redirect=false&contributor=David+Banister

Gold Overbought by Adam Hamilton

Adam Hamilton August 20th, 2011


Gold has enjoyed an amazing rally in recent weeks, catapulted higher by the extreme fear sparked by the sharp stock-market correction. Naturally such big and fast gains have led to a surge in gold’s popularity among investors and speculators, as everyone loves a winner. But gold prices flow and ebb like everything else, and this metal has become very overbought today.


Many gold enthusiasts’ hackles will bristle at the mere idea of gold being overbought. They will counter with many fundamental reasons why gold is heading higher, or argue that current newsflow will spark escalating buying. But gold’s long-standing bullish fundamentals do not override short-term technicals. When any price rallies too far too fast, including gold’s, the odds balloon for an imminent retreat.


As a hardcore contrarian, I started recommending physical gold coins to our subscribers as long-term investments way back in May 2001 when gold was universally loathed. It traded under $265 per ounce then! Over the long decade since, though gold has indeed powered higher on balance in a mighty secular bull, it has still weathered many corrections and consolidations after getting too overbought.


And at the eves of every one of these necessary selloffs to rebalance away excess greed, the majority of traders were wildly bullish. After any big and fast move, in any market, near-term enthusiasm waxes extreme. Traders’ collective bravery peaks near major highs, where they should be afraid of healthy selloffs. And if you follow the financial media, you know the love for gold today is pretty overwhelming.


Though sentiment is ethereal, impossible to directly measure, the price action that drives it is concrete. I suspect any technical tool you want to use will reveal gold to be very overbought today. Consider seasonals for example. Gold tends to drift sideways in the summer due to a lack of major income-cycle and cultural drivers of outsized investment demand. Obviously this hasn’t been the case this year!


This first chart is updated from my PM Summer Doldrums 3 essay of early June. It takes each summer’s gold action in this secular bull and indexes it individually to the last trading day in May. This enables us to compare every gold summer in perfectly-comparable percentage terms. The yellow lines are each summer from 2001 to 2010, the red line is the average gold performance of all these past summers, and the blue line represents 2011’s indexed gold action.


Summer 2011 initially began like most other summers, with gold meandering sideways to lower. But after bottoming in early July, gold started to rally. You remember the primary catalyst, the debt-ceiling debate in the US Congress was heating up. Though it was still a month until the Treasury’s August 2nd deadline for avoiding the first-ever US default, the fiery rhetoric started ramping anxiety.


The core fight over excessive government spending was simple. If you compare the average of Obama’s first 3 budgets with George Bush’s last 3, Obama grew federal spending by a gargantuan 28%! And this is saying a lot since Bush was a big spender too, making him very unpopular among fiscal conservatives. Obama orchestrated this massive federal-government growth during recessionary years where tax revenues were 11% lower on average. The result? A quintupling of Washington’s deficit to an insane $1.25t per year, and a 43% increase in the US national debt in less than 3 years of Obama!


Republicans wanted to rein government spending back in line with half-century averages in proportion to US GDP, while Democrats wanted to lock in Obama’s unprecedented government growth as the new normal going forward. As the Treasury’s early-August deadline loomed nearer and anxiety mushroomed, capital gradually migrated into gold. This drove rare sustained outsized investment demand in the summer months.


By the end of July, gold was 6.0% above its pre-summer May close. While this was a bit over the center-mass downtrend’s resistance as you can see above, it was still fairly normal for a gold summer. But all this changed on August 2nd when the stock markets sold off sharply despite a debt-ceiling deal being approved at the last minute. The S&P 500 plunged 2.6% and gold blasted 2.3% higher on safe-haven demand.


After that, it was off to the races over the past couple weeks. Gold rallied the most on days the stock markets were the weakest. And with plenty of huge down days in the stock markets, flight-capital demand for gold drove a series of outsized up days for this metal. The result is readily evident above, an anomalous, massive, and sharp summer rally. This drove gold to unprecedented summer-rally heights in August, much higher than anything yet seen in this entire secular bull.


By the middle of last week, gold had soared 20.4% higher in just over 5 weeks! It was up 16.7% on the summer, 36.5% since its 2011 lows in late January, and 26.2% year-to-date. These are super-fast moves for this giant asset. Are such huge gains over such a short period of time sustainable? They sure haven’t been in gold’s secular bull to date! This next chart shows gold’s 10-trading-day, 20-trading-day, and 30-trading-day returns throughout its entire decade-long bull.


By the middle of last week, gold’s 10d, 20d, and 30d gains ran way up at 10.9%, 13.2%, and 19.3%. This is hard to interpret without context, but this chart reveals just how rare such fast gains are. If you visually extend the latest yellow, orange, and red peaks back over the past decade, you can see that today’s levels are extremely rare and short-lived. Gold has never been able to sustain gains at such a blistering pace.


While gold’s latest big gains aren’t its best of this bull, after every prior big-gains spike gold soon fell sharply. Though these selloffs didn’t always last long, and weren’t always of correction-magnitude, they still happened like clockwork. Gold simply can’t sustain massive gains on the order of 10% over 2 weeks, 15% over 4 weeks, and 20% over 6 weeks. These are levels where gold is too overbought to continue rallying.


Overbought simply means a price has rallied too far too fast. It has nothing at all to do with absolute levels. Gold at $1800 might be perfectly reasonable given its global fundamentals, and its price will probably be considerably higher by the end of this year. But over the short term, in the coming weeks or couple months, gold will likely face some serious selling pressure after such a super-fast advance. These post-spike selloffs are purely psychological and are totally unrelated to fundamentals.


When any price rallies too far too fast, traders get too excited and greedy. These big gains lead everyone interested in buying that asset to chase the rally. But soon everyone interested in buying in anytime soon has already deployed their capital. With all the near-term buyers in, buying pressure is exhausted and greed burns itself out. At that point prices top and any selling at all overwhelms the dearth of buyers. The result is a fast plunge that crushes greed, sparks fear, and rebalances sentiment. This is very healthy.


Why couldn’t gold surge even higher first before correcting? Why not up 30% in 30 trading days? Just because it hasn’t happened yet in this bull doesn’t mean it can’t happen, right? Gold could indeed become even more overbought, there’s no doubt. But odds are it won’t. One of the key reasons the big short-term gains in this chart are never sustainable is the sheer colossal size of the global gold market.


According to the World Gold Council, about 170,000 metric tons of gold have been mined in all of world history. Though a little has been lost (unrecoverable shipwrecks, electronics, dental work), the vast majority is still around. Do the math and this works out to a staggering $9.8t worth of gold at $1800 per ounce! For comparison, at the end of last month the US MZM money supply was $10.1t, and all 500 elite companies of the flagship S&P 500 stock index had a collective market capitalization of $12.2t.


Gold is an unbelievably-big market these days, vast. And the bigger the market capitalization of any stock or asset, the slower it is to move. Just as a speedboat is far easier to turn than an oil supertanker, a small stock is far more volatile than a large one. And pushing $10t today (or even $7.2t back at its late-January lows), the collective value of the world’s aboveground gold supply is massive beyond belief. It is 25x larger than the biggest individual stock on the planet!


Such a gargantuan asset isn’t likely to move very fast, so outsized moves to the upside or downside relative to gold’s bull-market history never last for long. In fact, as you can see above gold tends to bounce back sharply to overshoot the other way soon after any notable extreme. After excessive short-term gains gold tends to collapse to excessive short-term losses, and vice versa. This is why traders need to be wary of extremely-overbought conditions like we’re seeing in gold today.


Gold’s major upleg surges that culminate in sharp vertical rallies have always been followed by sharp selloffs. These can be corrections, but are usually just consolidations (sideways grinds). Today’s gold surge is the fourth major one of this secular bull, as you can see above. The other three climaxed in extreme short-term gains that soon collapsed into huge outsized losses as sentiment was rebalanced.


Another way to measure gold overboughtness is with my very successful Relativity Trading system. It simply renders gold as a multiple of its own 200-day moving average. This is valuable for a couple reasons. First, it measures gold’s uplegs in perfectly-comparable percentage terms over time despite ever-higher gold prices as this bull marches on. Second, this multiple tends to form a horizontal trading range over time. This chart shows Relative Gold (rGold) in light red (left axis) since the stock panic.


Over the past 5 years, rGold has tended to top around 1.25x. In other words, once gold rallies so far so fast that it stretches 25%+ above its 200dma, it is unsustainably overbought and an imminent correction is due. This last happened back in early-December 2009, when gold had “only” surged 15.1% in 30 trading days to hit 1.248x relative. What happened right after this surge to very-overbought levels? Gold immediately corrected, falling 12.6% over the subsequent 9 weeks into early-February 2010.


Back then I wrote an essay about gold being overbought the very week it topped. And as expected with any outlook contrary to popular consensus, that thesis ignited a firestorm of criticism and even ridicule. People accused me of being stupid, ignoring fundamentals, not paying attention to news, of being anti-gold, and worse. Though contrarian traders fighting the crowd earn massive profits, contrary opinions near extremes are never popular. But overbought prices soon correct, whether we like it or not.


It’s provocative that gold hasn’t even approached those December 2009 extremes in relative terms again until this past week! On Wednesday August 10th, gold surged 3.1% higher on a nasty 4.4% S&P 500 (SPX) down day, hitting a new all-time nominal high. But it was stretched to 1.231x relative, very overbought by its own bull-to-date standards. Then again on Thursday the 18th as I am writing this essay, another big SPX down day drove another big gold up day to even higher relative levels.


Can gold sustain being stretched 25%+ above its 200dma? Is enough new capital going to flood in right now to drive a $10t asset higher to even more-overbought extremes? Maybe, anything is possible in the markets. But based on gold’s bull-to-date precedent for summer behavior, absolute short-term gains, and stretching above its 200dma, the odds for this rally persisting are very low. And prudent successful traders never bet on low-probability-for-success outcomes.


Usually after seeing similar extremes to today’s, gold corrects back down to its 200dma. In the context of a secular bull, such 200dma approaches are common after major uplegs. They are no big deal technically from a long-term perspective, and are actually very healthy as they rebalance sentiment to extend a bull’s longevity. But in real-time, they feel incredibly brutal. Today gold’s 200dma is way down near $1465, 18.1% and $325 lower from its recent highs! Can you weather such a selloff unscathed?


And even if gold doesn’t make a 200dma approach after being so overbought this time, any conceivable correction level you want to mark on this chart is way lower from here. Merely to get back down to the upper resistance of its strong post-panic uptrend, gold would have to fall to $1600 or so. This is 10.6% and $190 lower than its recent highs! Very-overbought markets have lots of room to correct hard and fast, they slaughter those who trifle with these serious risks.


What could drive such a sharp gold selloff? The most-likely catalyst is a major stock-market rally. It sounds crazy I know, but after such extreme fear a huge stock-market rally is highly probable as I explained in my essay last week. Gold’s summer rally didn’t start surging and getting excessive until early August as the stock markets started plunging. This metal’s big up days in recent weeks corresponded exactly with big SPX down days.


Capital fleeing the stock selloff understandably flooded into gold, and inflows into the flagship GLD gold ETF empirically verified this. But as the stock markets inevitably bounce out of those extremely oversold and hyper-irrational lows, some of the capital that has been hiding out in gold will surely exit. Just as the gold buying pressure fed on itself in recent weeks, so will any selling pressure. As gold accelerates lower, more and more traders will get scared and start exiting their recent positions they bought near highs.


In the first 8 trading days of August alone, gold soared an unbelievable 10.1%! This created a trillion dollars of wealth! The SPX lost 13.3% over this exact span, driving the atypical summer surge of capital into gold. But after such anomalously-extreme selloffs, stock markets tend to bounce fast. If the SPX gains 10% in the coming weeks, again highly likely, will gold fall 5% or 10%? Probably. And the faster it drops, the more the selling will feed on itself and drive a sharp correction.


It is really pretty ironic to see gold overbought this time of year, as gold seasonals tend to bottom in the first half of August. Usually right now is one of the best buying opportunities of the year for this precious metal, as it is usually unloved and oversold after a demoralizing grind in its summer doldrums. So it does seem strange to see gold technicals predicting an imminent correction just as the strong autumn seasonals are due to begin.


But it is crucial to remember that seasonals are only secondary drivers at best. Sentiment, popular greed and fear, is always the primary short-term driver of any price while fundamentals are the primary long-term driver. Extreme greed necessitating a correction easily overrides any seasonality. But once this correction happens and sentiment is rebalanced, bullish seasonality can reassert itself. And though a gold correction off of today’s extremes is likely to be big and sharp, it ought to be relatively short-lived (weeks to a couple months at worst).


Being a contrarian is very challenging, it is hard fighting the crowd. It is stressful and wearying to buy stocks aggressively over the past few weeks while everyone else thinks the markets are heading into a new panic. It is no fun to see gold overbought and expect a selloff right on the verge of the big autumn buying season. I am going to get a blizzard of hate mail for this essay, mocking me to no end. Yet buying when others are afraid and selling when others are brave is the surest way to make a fortune in stocks.


We’ve been doing this publicly for over a decade at Zeal, with spectacular results. All 591 stock trades recommended in our newsletters since 2001 have averaged annualized realized gains of +51%! This includes all our losing trades, includes weathering the brutal 2008 stock panic, and was achieved in a massive decade-long sideways-grinding secular stock bear. If you want to rapidly multiply your wealth in the stock markets, you have to steel yourself to be a contrarian and fight the crowd.


If you’re tired of mindlessly buying high when everyone else is bullish and then selling low at the first sign of real fear, and perpetually losing money, you ought to subscribe to our acclaimed weekly or monthly newsletters. In them I explain what the markets are doing, why, and where they are likely heading next. They distill our vast knowledge, wisdom, and experience into high-probability-for-success trading opportunities in specific stocks. Subscribe today and start thriving in these crazy markets!


The bottom line is gold is very overbought today based on its own bull-to-date precedent. The combination of the debt-ceiling anxiety and an overdue and sharp stock-market correction drove rare outsized gold demand in the summer doldrums. But so much capital flowed into gold that it rallied too far too fast to be sustainable over the near term. A healthy correction is necessary to rebalance sentiment.


If the stock markets stoke more fear, gold may edge a little higher first. But sooner or later the wildly-oversold stock markets will bounce and some of the flight capital hiding in gold will exit. This selling will rapidly feed on itself, likely driving a sharp yet short-lived correction. If this comes to pass, investors and speculators alike should prepare for an excellent buying op early in gold’s strong autumn rallying season.

http://www.24hgold.com/english/contributor.aspx?article=3607147170G10020&contributor=Adam+Hamilton